I’ve been using vRealize Ops for nearly a decade now, and have been enjoying watching it evolve in that time. Since vRealize Operations 8.0, we’ve been able to monitor most of the leading hyperscaler cloud platforms. I thought I’d take a look at monitoring my AWS Free Tier environment via vRops.
I work with several customers that have large multicloud environments, usually consisting of on-premises vSphere with at least two of the leading hyperscaler environments. One of the things they tend to encounter is limited visibility into deployed workloads – where they are, what they do, who owns them, how much they cost.
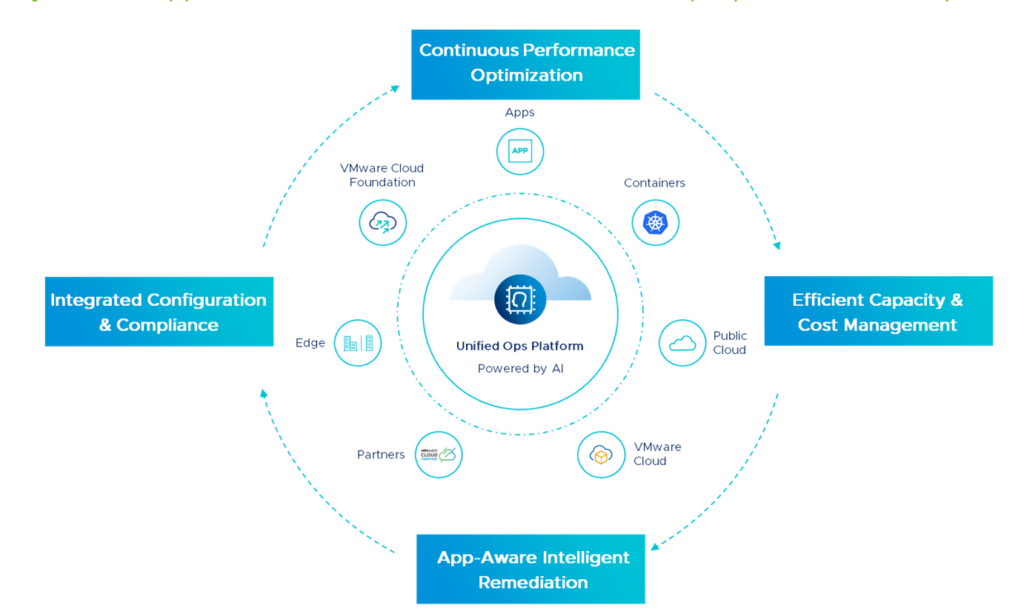
vRealize Operations provides this multicloud environmental overview for AWS and Azure out of the box, as well as others via management packs. The list of supported services is extensive, see the AWS and Azure lists. We can provide full visibility of all workloads, regardless of your cloud of choice, or even type of workload – I focus on EC2 in this article, but we provide full support for a significant number of cloud native services, including Kubernetes.
I’ve started off with a fresh deployment of vRops 8.3.0. Keep in mind vRealize is available via a SaaS deployment through vRealize Cloud Universal. Faster release cycles, less admin effort, better results.
Creating AWS IAM Policy
First I need to create an account and apply permissions that will allow my vRops instance to access my AWS tenancy.
- Log in to AWS Console
- Navigate down to Security, Identity & Compliance > IAM
- Select Access Management > Policies > Create Policy
- Have a read of the vRops 8.3 documentation on creating IAM Policies – the JSON I used is based on the one in that document, with a few EC2, S3 and Route 53 permissions added
{
    "Version": "2012-10-17",
    "Statement": [
        {
            "Action": [
                "autoscaling:Describe*",
                "cloudwatch:Describe*",
                "cloudwatch:Get*",
                "cloudwatch:List*",
                "cloudwatch:ListMetrics",
                "cloudwatch:GetMetricStatistics",
                "logs:Get*",
                "logs:List*",
                "logs:Describe*",
                "logs:TestMetricFilter",
                "logs:FilterLogEvents",
                "sns:Get*",
                "sns:List*",
                "elasticloadbalancing:Describe*",
                "ec2:Describe*",
                "s3:ListBucket",
                "s3:GetBucketTagging",
                "route53:Get*",
                "route53:List*",
                "route53:TestDNSAnswer"
            ],
            "Effect": "Allow",
            "Resource": "*"
        }
    ]
}
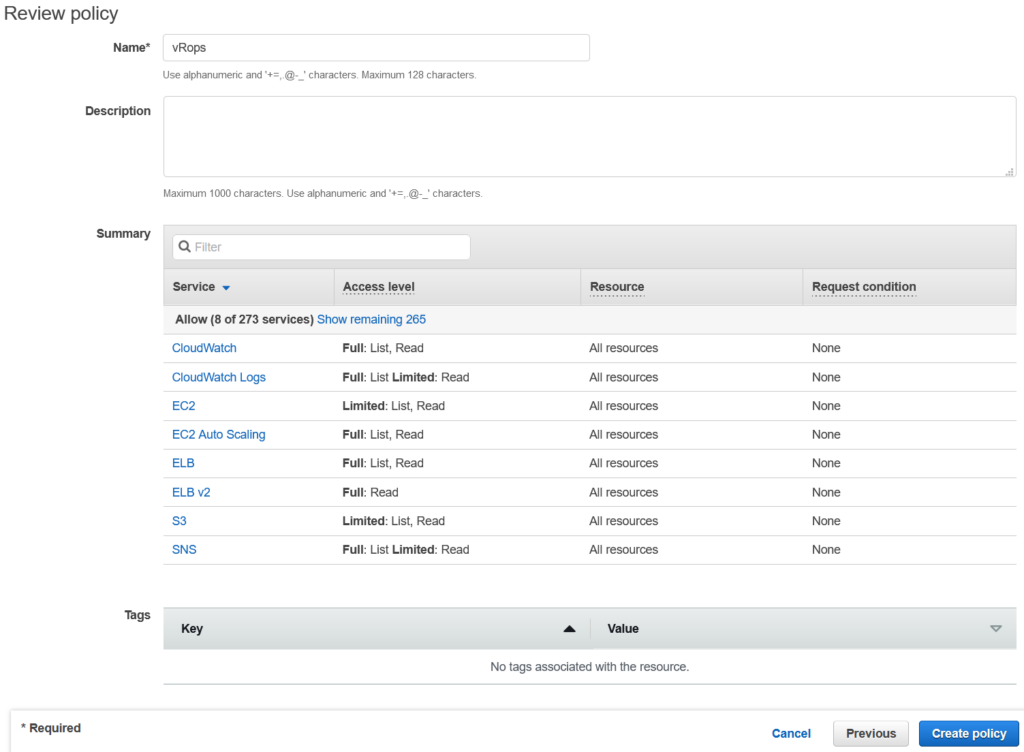
- Add any tags you need to the policy, then select Review
- Give the policy a name, and double check the summary. Click Create Policy
- Back in IAM, select Access Management > Users > Add User
- Give the user a name, tick the Programattic Access button. Select Permissions
- Select Attach existing policies directly, scroll all the way down to the vRops policy and tick the box. Click Tags
- Add a tag if required. Click Review
- Review everything, then click Create User
- Make sure you record the Access Key ID and Secret Access Key securely.
- Head back into vRops > Administration > Solutions > Cloud Accounts > Add Account
- Select AWS
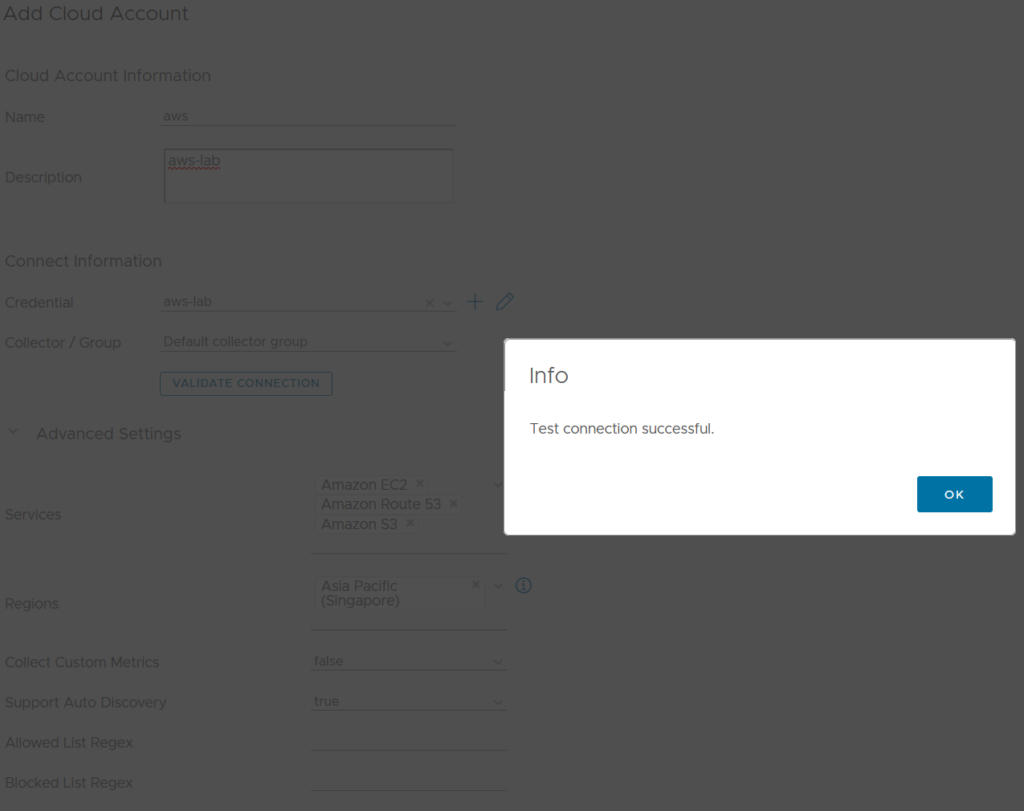
- Enter a name for the collector, then click the + buttron next to Credential in order to enter the IAM user credentials.
- You can choose to select specific AWS services to monitor – I’ve chosen EC2, Route 53 and S3 for now, and specified only the Singapore region.
- Click Validate Connection
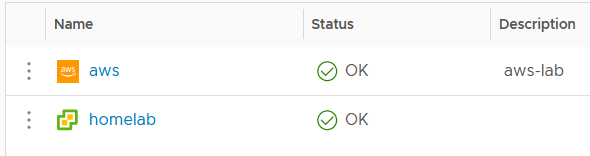
- Click Add to create the adapter. You’ll see a Warning status next to the AWS adapter for a few minutes, until collection starts up.
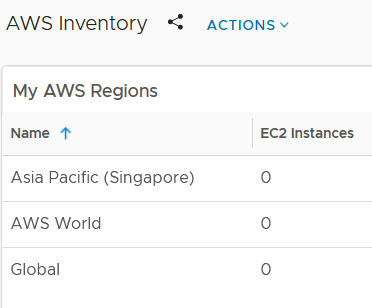
- My AWS collector is now working fine, but I don’t have any EC2 machines to monitor. Let’s fix that.
- Back in the AWS Console, navigate to EC2 > Launch Instance
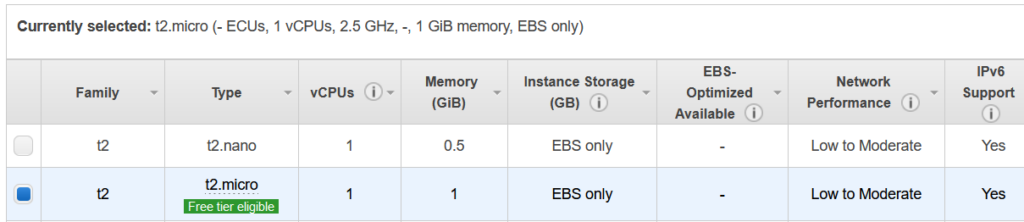
- I’m operating on a home lab budget, so I have ticked Free Tier Only
- I want something quick and dirty, so I’ve picked the first AMI Image – t2.micro to get the free tier.
- Select Review and Launch
- Select View Instances to keep an eye on your pending t2.micro ec2 machine. Once it’s up and running, we can head back to vRealize Operations, where we will soon see the machine in the inventory.
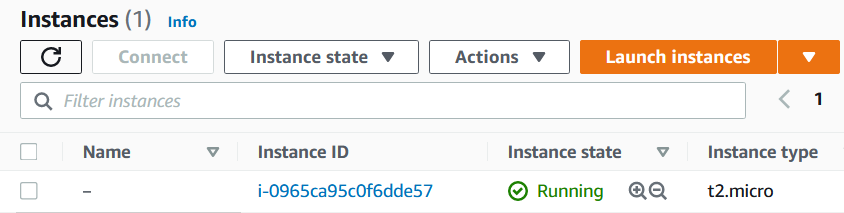
- After a few minutes, success!
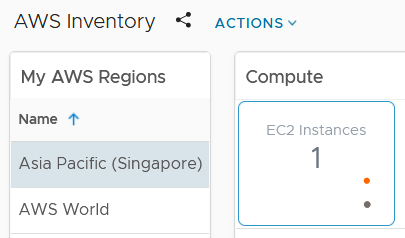
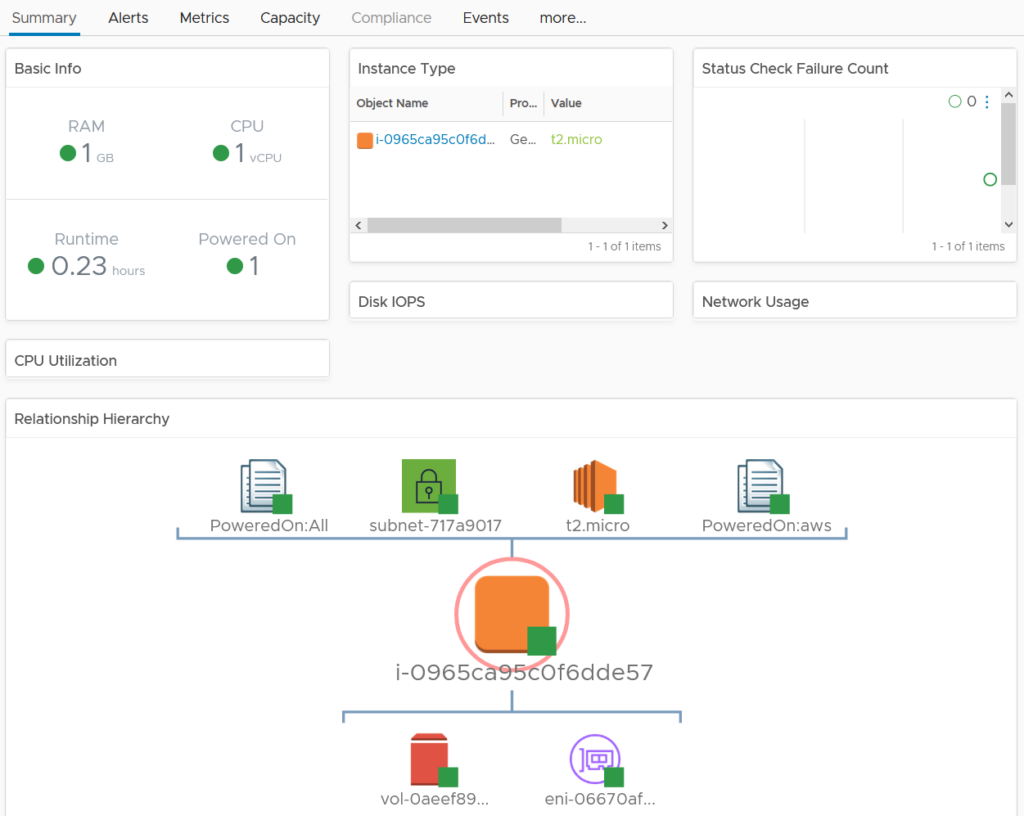
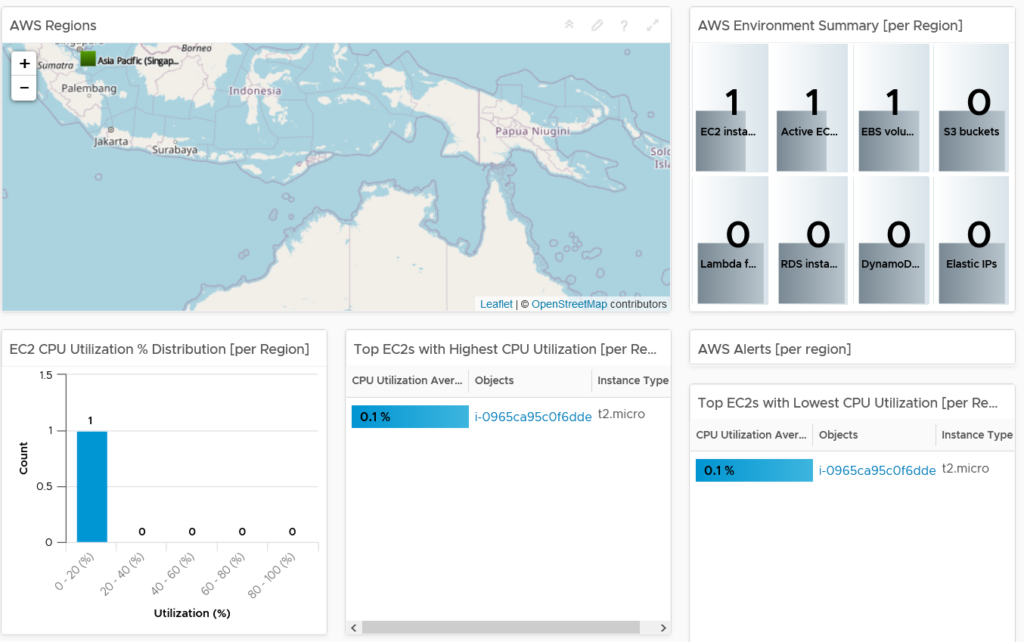
I can now monitor this EC2 machine in the same way I would any other vSphere object. I can proactively capacity manage, report performance, troubleshoot and audit via tags.
For an large environment with many EC2 instances, I can use the Compute: EC2 dashboard to provide a global overview.